Heat, Dust, and People
Geographic information systems reveal how health risks from extreme weather combined with air pollution vary within large Latin American cities.
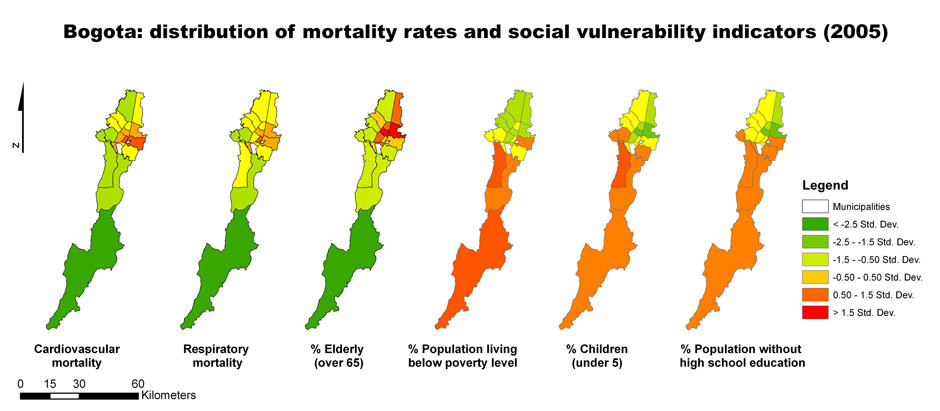
Bogota Distribution of mortality rates and social vulnerability indicators (2005)
These maps show the geographic distribution of human mortality rates attributable to heart and lung disease and the distribution of vulnerable groups (as percent of the total population) in the city of Bogotá, Colombia, for 2005. Data are classified by their standard deviation. Standard deviation is a measure of the dispersion of a data set around the mean. Orange-colored districts are just outside the range of the expected dispersion or ‘standard deviation’. In the red areas the variable in question is at least 1.5 standard deviations higher than average, and in green areas the value is at least 2.5 standard deviations below the average. The limits of 1.5/2.5 standard deviations were chosen to provide a robust indicator of values that are far outside of the usually expected “normal” distribution around the average.
This IAI project uses Geographic Information Systems (GIS) to analyze social vulnerability to global change. The results provide city planners with an understanding of how demographic and socio-economic vulnerabilities change mortality risk across city neighborhoods. Such vulnerability analyses have provided the basis for chemical weather forecasts for Bogotá and other large South American cities, and allow municipalities to respond
to climate and air pollution hazards.
Respiratory and cardiovascular causes of mortality are two important health effects of the combination of heat or cold waves and pollution in cities. The effects are not equal on all population groups, children and the elderly being affected through different mechanisms. This requires programs tailored to address the specific health risks for such groups.
Science Snapshots 6 – The Story
Under global warming, urban areas are increasingly affected by heat waves. Climate change and urban heat-island effects deteriorate the meteorological and atmospheric conditions of cities and threaten human health. We are now learning how extreme temperatures (both heat waves and cold spells) and air pollution act together to increase health risks. This information is needed to better plan for the effects of extreme weather and air pollution episodes. Geographic Information Systems (GIS) provide computer visualization, database management and spatial analysis to organize such information for planning and intervention.
Scientists in the IAI-funded project Adaptation to the health impacts of air pollution and climate extremes in Latin American cities (ADAPTE) investigate these interactions in Bogota, Buenos Aires, Lima, Medellin, Santiago, and São Paulo. They found that levels of fine dust particles (smaller than 10 µm, the so-called PM10) in the air of Mexico, Santiago and Bogota dangerously exceed the standards of the World Health Organization (WHO) by 90%, and that the levels of nitrous oxides (NOx) pollution in these three cities exceed WHO standards by 73%, 38% and 25%, respectively. An on-line data base has been compiled that will be used to develop automated emission scenarios; so far this is available for Medellin (http://modemed.upb.edu.co/). Based on the project’s work, the Chilean Weather Office is now providing chemical weather forecasts for Santiago (http://www.meteochile.cl/modeloPOLYPHEMUSozono.html).
A series of maps was created to show the geographical distribution of health data and social vulnerability factors in the ADAPTE cities. The maps on the front page show this distribution for the districts of Bogota. The distributions of cardiovascular and respiratory mortality do not follow the north-south gradient in wealth and education, which points to more complex relationships that include age characteristics of the populations.
To investigate these, the ADAPTE team calculated the likelihood or relative risk (RR) of citizens dying from exposure to the combined pollution-temperature effects. The highest RR’s for respiratory mortality were found in Buenos Aires (RR: 1.03) and Mexico City (RR: 1.00) during the warm season. However, in Bogota, particularly children showed a higher respiratory RR during the cold season (RR: 1.20).
For cardiovascular mortality, the highest RR’s were found in Mexico City and Buenos Aires (RR: 1.01) during the warm season. Cardiovascular RR in Bogota was higher for the elderly in the cold season
(RR: 1.00). These relationships are currently being explored through spatial and statistical analysis.

Further reading
Romero Lankao, P., O. Wilhelmi, M. Cordova Borbor, D. Parra, E. Behrenz, L. Dawidowski (2010): Health impacts of weather and air pollution – what current challenges hold for the future in Latin American cities. In: The Changing Environment for Human Security: New Agendas for Research, Policy, and Action, edited by K. O’Brien, L. Sygna and J.Wolf, GECHS, Oslo Norway (forthcoming).
Romero Lankao, P. M. Cordova Borbor (2010): On the nature of risks: Insights from health risks in three Latin American cities. In: Global Environmental Change, Special issue on Climate Change, Social Stratification, and the Politics of Intervention (under review)
Global Change Science Snapshots are intended to inform IAI clients and the interested public about important results of international research carried out under IAI auspices.
Editorial Board: Christopher Martius, Ione Anderson, Paula Richter, Holm Tiessen
Design: Shadi Ardalan
Cite as: IAI (2010): Heat, dust, and people. Geographic information systems reveal how health risks from extreme weather combined with air pollution vary within large Latin American cities. Science Snapshots 6. IAI
Funded under CRN 2017 by IAI, NSF.
Ver Project website
Download PDF
Download PDF in Spanish